
Description of the Menu Mix Report
The Menu Mix Report provides a detailed analysis of all menu items sold within a selected date range. It helps in understanding which Item categories and items contribute most to overall sales, offering insights into performance, pricing, and sales composition. This report assists in making data-driven decisions regarding menu optimization and inventory planning.
Key Details included in the Report
- Report Location: POS Dashboard → Menu Mix Report
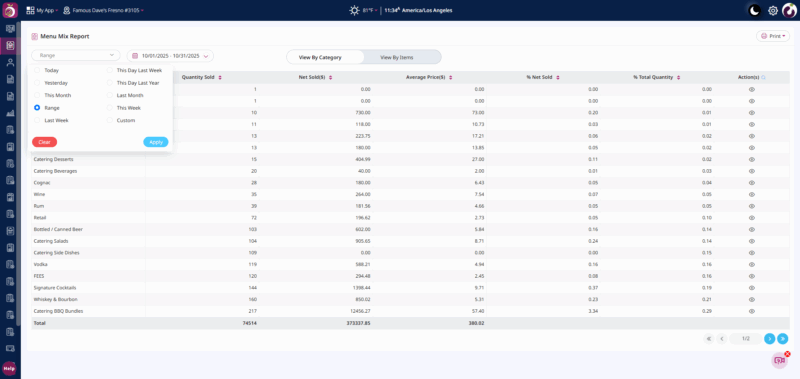
- Filters Available:
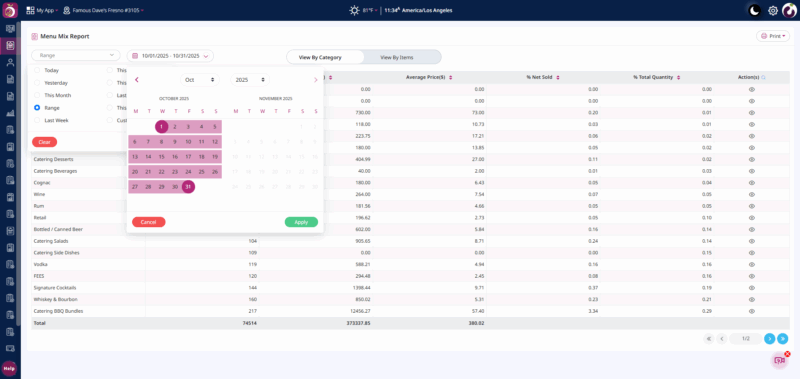
- Date Range Selector: Choose a specific date or custom range to view report data.
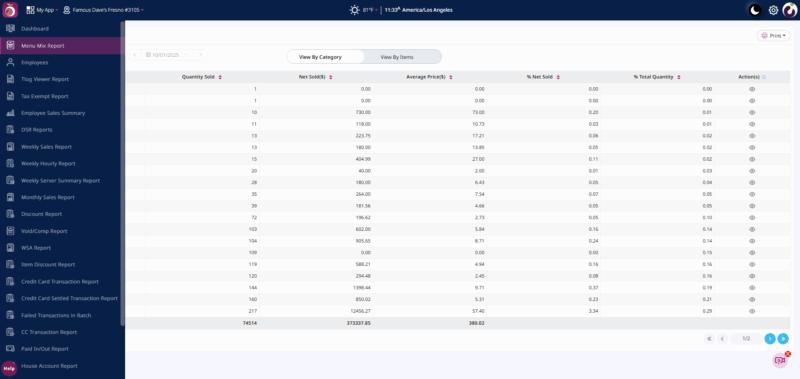
- View Toggle:
- View By Category: Displays summarized sales data for each Item category.
- View By Items: Displays detailed data for individual items under each category.
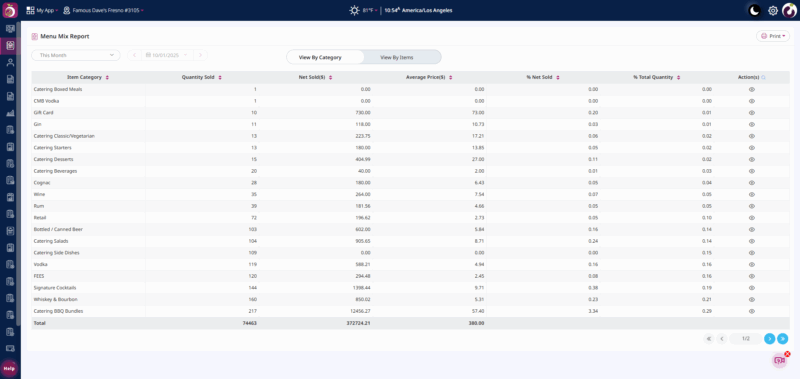
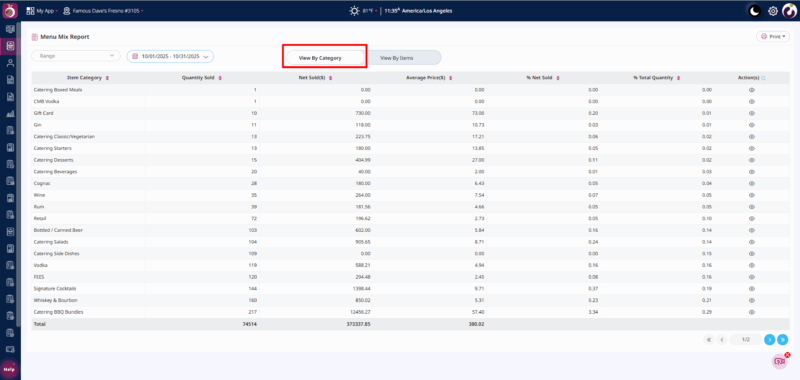
View by Category
- Item Category: Displays the main category of menu items (e.g., Specialty Pizza, Adult Beverage, Child Buffet). Each row represents a unique menu category.
- Quantity Sold: Shows the total number of items sold within the selected category during the chosen date range.
- Net Sold ($): Indicates the total net sales value (after applying discounts and excluding taxes) for the entire category.
- Average Price ($): Represents the average selling price per item within that category, calculated by dividing Net Sold by Quantity Sold.
- % Net Sold: Displays the percentage share of the category’s net sales in relation to total net sales across all categories. This helps identify which categories contribute most to revenue.
- % Total Quantity: Shows the percentage contribution of the category’s total items sold compared to all items sold in the selected period.
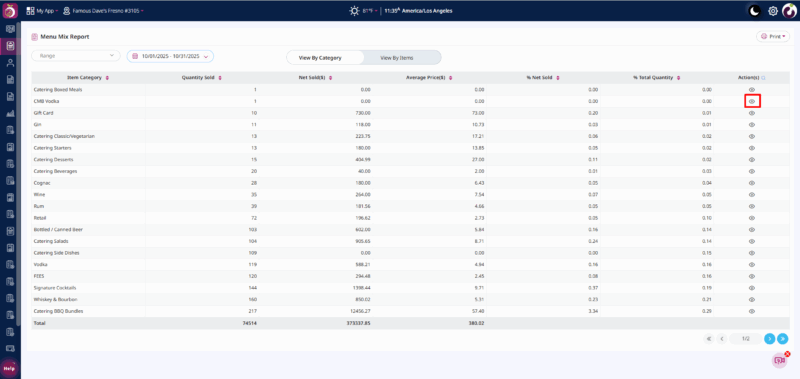
- Action(eye icon): Clicking this icon expands the category to show a detailed breakdown of individual items under that specific category (View by Items).
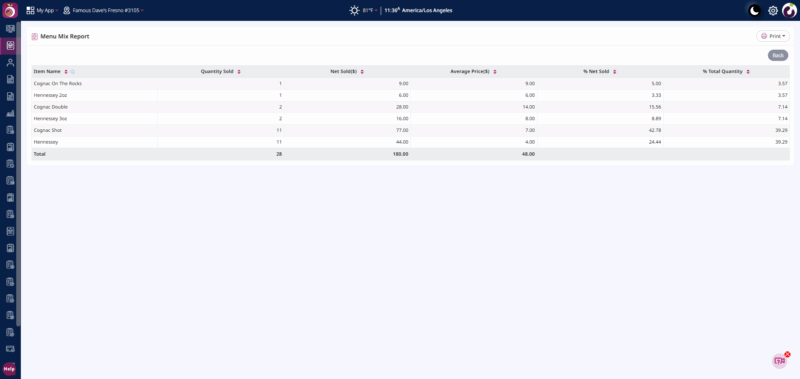
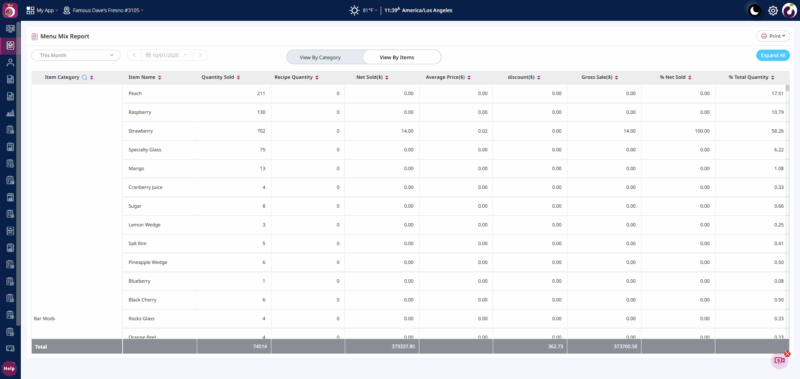
View by Items
- Item Category: Displays the parent category under which the item belongs (e.g., “Adult Beverage” or “Buffet”).
- Item Name: Shows the exact name of the item sold (e.g., “Regular Drink”, “Large Pizza”). Each item name is listed under its corresponding category.
- Quantity Sold: Indicates the total quantity sold for each specific item during the selected date range.
- Recipe Quantity: Represents the recipe quantity or portion size associated with the sold item. Useful for inventory and cost analysis.
- Net Sold ($): Shows the total net sales value for the individual item, excluding discounts and taxes.
- Average Price ($): Displays the average selling price per item, calculated as Net Sold divided by Quantity Sold.
- Discount ($): Indicates the total discount value applied to the item during the selected period.
- Gross Sales ($): Displays the total sales amount before discounts are applied. It represents the item’s original sale value.
- % Net Sold: Reflects the item’s contribution percentage to the overall net sales across all items.
- % Total Quantity: Represents the item’s share in the total quantity of items sold. This helps in identifying popular or high-volume items.
Steps to View the Report
Step1: Navigate to the Menu Mix Report in the POS Dashboard.
Step2: Select the Date Range using the calendar filter or choose a predefined period.
Step3: Choose View by Category at the top of the report:
- View by Category: Displays a summarized view by menu categories (e.g., Wings, Specialty Pizza, Beverages).
Step4: Click the Eye Icon under the Action column to view a detailed breakdown of items under a specific category.
Step5: Review the summary row at the bottom for total sales, quantities, and averages.
Step6: Choose View By Items at the top of the report:
View by Items: Displays item-level details including discounts, gross sales, and recipe quantity.
Purpose:
The Menu Mix Report is designed to help the management teams understand the sales performance and composition of the menu. It provides actionable insights into what’s selling, how much revenue each item contributes, and where improvements can be made.
Benefits:
- Performance Insights: Quickly identify top-selling and underperforming items to make menu adjustments.
- Profitability Tracking: Compare net vs. gross sales and understand the impact of discounts and recipe costs.
- Data-Driven Decisions: Empower the sales and management team to make informed pricing, promotion, and inventory choices.
- Operational Efficiency: Save time by viewing both summary and detailed item data in one place.
- Strategic Menu Planning: Use category and item-level data to decide which items to promote, revise, or remove from the menu.
- Enhanced Customer Understanding: Analyze which items attract the most customers and contribute the most revenue.